
DC resistance, parasitIC capacitance and parasitic inductance of PCB layout
Many designers are used to considering system behavior from the following aspects: PCB board model These models and circuit diagrams are correct to some extent, but they lack some important information that determines the behavior of the system The missing information in the circuit diagram is the actual PCB layout, which determines how the components in the system are electrically and magnetically coupLED to each other So, what causes electromagnetic coupling between circuit components, conductor, ferrite, and other complex PCB or IC in the real world? This is determined by the interaction between electromagnetic field and matter. However, a conceptual method to summarize the signal behavior in complex systems is to consider the coupling of parasitic circuit components, or parasitic for short The introduction of parasitic effects into circuit models can help you explain unexpected or unexpected signal and power supply behavior in actual systems, making parasitic modeling tools very helpful for understanding circuit and product behavior
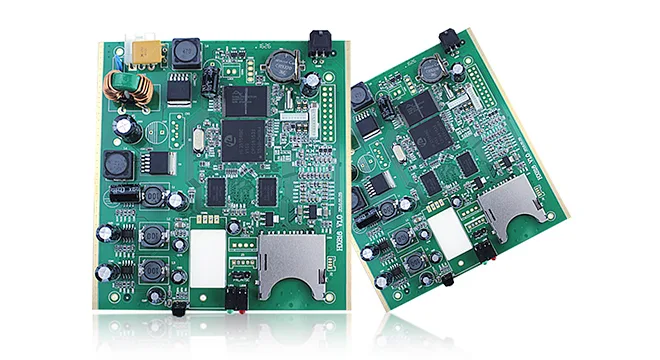
PCB board

This is because the circuit diagram cannot explain some important functions of the actual PCB board, integrated circuit or any other power system. Parasitic effects are represented in circuit diagrams as resistors, capacitors, and inductors, depending on their behavior in the frequency domain. Note that parasitism is discussed almost entirely in terms of LTI circuits, which means that parasitism is also considered linear and time-varying. Time varying and nonlinear parasites use more complex modeling techniques, involving manual iterative operations in the time domain. They may also be very sensitive to the initial conditions of the system, especially in the presence of reverberation. Although the actual PCB board is very complex, the LTI system covers most of the actual power systems. To determine the parasitic effect is essentially to determine the frequency behavior of the system, because the influence of parasitIC components on the signal is a function of frequency. By comparing the frequency behavior of [ideal system+possible parasites] with [actual system measurement value], we can identify parasites that may produce frequency related behaviors in the system.
What determines the parasitic effect and what is not considered in the circuit diagram?
Many aspects of a real system may produce unexpected parasitic effects in PCB layout, IC, or any other power system. Before attempting to use SPICE analogy to select parasites, please pay attention to what cannot be considered in the circuit diagram. The distance between various conductors, their arrangement on the circuit board and their cross-sectional area will determine the DC resistance, parasitic capacitance and parasitic
Inductance. Dielectric constant: The dielectric constant of PCB board is high, which determines the parasitic capacitance between circuit components. Permeability: For magnetic components, permeability also plays a role in determining signal and power behavior because these components generate parasitic inductance. When working at high frequencies, ferrite transformers and other magnetic components can work like inductors or radiators.
Traveling wave behavior. Any signal propagated in the actual PCB board and interconnection is a propagation waveform. The propagation of electromagnetic waves produces transmission line effects in interconnects, which cannot be modeled with SIMple circuit diagrams. Your SPICE analogy needs to be modified to take into account the limited speed of the waveform. Like fiber braiding effect, especially the phenomenon in PCB board, it is difficult to easily simulate through circuit modeling or post layout simulation, because the involved circuit model may become complex. However, circuit analogies can help you extensively examine frequency related behavior in PCB boards. Other parasites, such as input/output capacitors or bond line inductors on integrated circuits, can be easily determined because the type and location of the parasitic can be determined.
The following example schematic diagram shows a typical circuit model for checking and interpreting ground bounce in integrated circuits. This effect is caused by the parasitic inductance in the ground wire (MARKed L in the diagram). However, there are other factors in the circuit that can affect the behavior of the circuit when the ground bounce occurs. The two capacitors at the driver output and load input are similar to the parasitic capacitance caused by the pins on the IC. The resistor on the I/O line is analogous to its parasitic DC resistance. The objective of parasitic selection is usually to estimate the frequency related behavior of the system, so that the system can be broadly described as capacitive or inductive in a certain frequency range. Using the schematic type shown above, you can select parasitic effects by comparing the analog results with experimental measurements. Simply use frequency scanning to simulate circuits, or use pulses to provide transient analysis of circuits. Then, you need to compare the results with the measurement data to identify parasites in the system.
There are two ways to select parasites from spices. Both methods need to understand the parasites that may exist in the system, or compare with the measurement results of the finished PCB layout:
1) Analytical methods, including the use of analytical equations to calculate the frequency dependent behavior of ordinary or nontrivial circuit models. Component values are usually derived from tables or previous experience.
2) The regression method used when the equivalent value of the parasitic circuit element is unknown, although the general model describing the relationship between the parasitic circuit and the measured value is known. Standard regression methods can be used to determine the consistency between models and data.
In the following example, we will consider how to run the PSpice analogy required by the two methods. We will assume various possible values and use SPICE analogies to examine frequency responses, rather than assuming individual values for various parasites. The results can be used to establish a model, which describes how the frequency response of the circuit depends on some stray values, and then can be used to calculate the stray values according to the measured data.
As an example, let's see how to select the parasitic capacitance in the capacitor by identifying the self resonant frequency of the capacitor. Due to parasitic series resistance and inductance, self resonance is a well-known phenomenon in high-frequency capacitors. In the following diagram, we have a capacitor rated at 4.7pF. We want to select parasitic inductance and resistance. Here, we scan the frequency of the source and also the spurious value. This is done by scanning the parameters in the frequency domain, which will provide a set of curves for our current measurement. They can then be used to select self resonant frequencies and ESL values. To do this, you need to set global parameters for each component value to be scanned. This is done by adding a parametric part to the schematic, and then entering the parameter name in the component value. The data selected from the SPICE analogy can be used for analytical or regression methods. In the analysis method, as long as there is a frequency response model as a function of the parasitic value (in this case, the capacitor self resonant frequency), the parasitic value can be directly calculated from the analog response. In the above example, we want to compare the measured impedance or self resonance with the class ratio to determine the accurate value of the parasite. If the analog and measurement curves are very similar, the model can accurately describe the behavior of the circuit. In fact, you won't have such a perfect match. Recall that you must fit the analog data (in this case, the self resonant frequency) to the model (usually linear or power law). Then, you can insert the observations from the measurement data into the model to calculate the values of the relevant parasites. Similar technologies can be used for other tests and environments.
When to return to layout
At a certain moment, the actual PCB layout becomes so complex that trying to extract basics by fitting an equivalent circuit model becomes tricky Technically, you can write a program to repeatedly fit data and some predefined experimental models, but your program would still have to see exactly what the similar was and its equivalent circuit arrangement (parallel, series, or non trivial) products signaling behavior At this moment, another method is to return to the field solver from PCB layout It is very simple to select parasites in the rear layout view Simply select the interconnects you want to analyze and run the AutoPick tool The integrated field solver will calculate PCB layout directly from Maxwell equations
然后
聯(lián)系
電話熱線
13410863085Q Q

微信

- 郵箱


